Inverse Functions (Economics)
Inverse Functions
An inverse function “undoes” the work of a function. We typically denote inverse of the function f(x)f(x) by f−1(x)f−1(x).
For example, if a function f(x)f(x) added 22 to xx and then squared the result, the corresponding inverse function f−1(x)f−1(x) would take the square root of xx and then subtract 22: f(x)=(x+2)2f(x)=(x+2)2 f−1(x)=√x−2f−1(x)=√x−2
Because the inverse of a function does the opposite to the function, if we apply a function and then apply its inverse, we should get back the original value: f−1(f(x))=xf−1(f(x))=x For example, consider the function g(x)=10xg(x)=10x. The inverse of this function is g−1(x)=x10g−1(x)=x10. Applying gg to xx and then g−1g−1 gives: 10x10=x10x10=x
Note: The −1−1 in f−1(x)f−1(x) is not a power.
Finding the Inverse Function
For example, suppose we want to find the inverse of the function f(x)=x2−1f(x)=x2−1. We can do this using the following three steps:
1) Replace f(x)f(x) with yy.
2) Swap the independent variable xx with the dependent variable yy. This gives x=y2−1x=y2−1.
3) Rearrange the function to make dependent variable yy the subject. This gives y=√x+1y=√x+1.
4) Finally, replace yy with f−1(x)f−1(x). The inverse of f(x)=40x−9f(x)=40x−9 is therefore f−1(x)=√x+1f−1(x)=√x+1
Graphing the Inverse Function
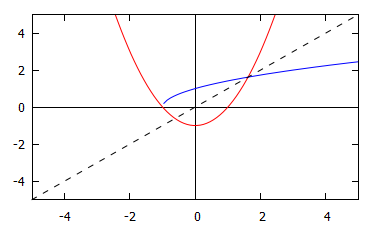
We can draw the graph of the inverse of a function by reflecting the graph of the function in the diagonal line y=xy=x. The graph below shows the curves f(x)=x2−1f(x)=x2−1 in red, and f−1(x)=√x+1f−1(x)=√x+1 in blue. The dotted line is y=xy=x.
Worked Example
Question
Find the inverse function of f(x)=4−5xf(x)=4−5x. Plot the function and its inverse in the same graph.
Solution
Following the above steps, we have:
1) y=4−5xy=4−5x
2) x=4−5yx=4−5y
3) x=4−5y⇒x+5y=4⇒5y=4−x⇒y5=14−x⇒y=54−xx=4−5y⇒x+5y=4⇒5y=4−x⇒y5=14−x⇒y=54−x
4) f−1(x)=−5x−4f−1(x)=−5x−4
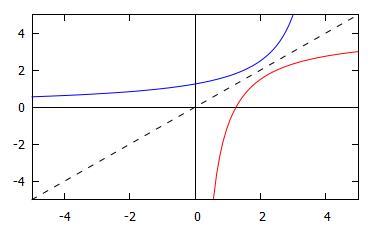
This graph shows the lines f(x)=4−5xf(x)=4−5x in red, and f−1(x)=5x−4f−1(x)=5x−4 in blue. The dotted line is y=xy=x.
Video Example
Prof. Robin Johnson finds the inverse of the function f(x)=2−1xf(x)=2−1x.
Workbook
This workbook produced by HELM is a good revision aid, containing key points for revision and many worked examples.
External Resources
- Inverse functions workbook at mathcentre.