Speed-time and Distance-time graphs (Mechanics)
Speed-time graphs
In a speed-time graph speed is always plotted on the vertical axis and time is always plotted on the horizontal. This represents the motion of a particle accelerating from a speed at time $0$, $u$, to a speed $v$ at time $t$.
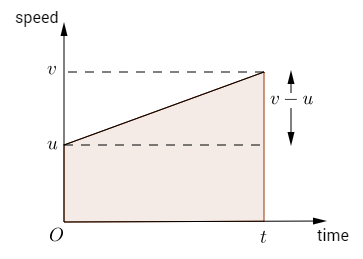
The gradient of the line of the speed-time graph is the acceleration of the particle (for straight lines acceleration is constant). \begin{align} \text{Gradient of line} & = \frac{\text{change of velocity} }{\text{time} }, \\ & = \frac{v - u}{t}, \\ &= a. \end{align} The area under the speed-time graph is the distance the particle travels. \begin{align} \text{Shaded area} & = \left( \frac{u + v}{2} \right)t, \\ & = s. \end{align}
Distance-time graphs and Acceleration-time graphs can also be drawn for the motion of a particle, where time is always plotted on the horizontal axis.
A straight line on a distance-time graph represents that a particle has constant speed. Curvature suggests that a particle is accelerating or decelerating.
Worked Example: Speed-time graphs and acceleration-time graphs
Example with a car along a straight road
A car drives along a straight road. The car accelerates uniformly from rest to a speed of $10 \mathrm{ms^{-1} }$ in $2T \mathrm{seconds}$. It then travels at a constant speed for $1 \mathrm{minute}$. The car then decelerates uniformly to rest in a further $8T \mathrm{seconds}$. Sketch a speed-time graph to illustrate the motion of the car. If the total distance travelled by the car is $800\mathrm{m}$, find the value of $T$ and sketch and acceleration-time graph to illustrate the motion of the car.
Solution
We sketch the following speed-time graph.
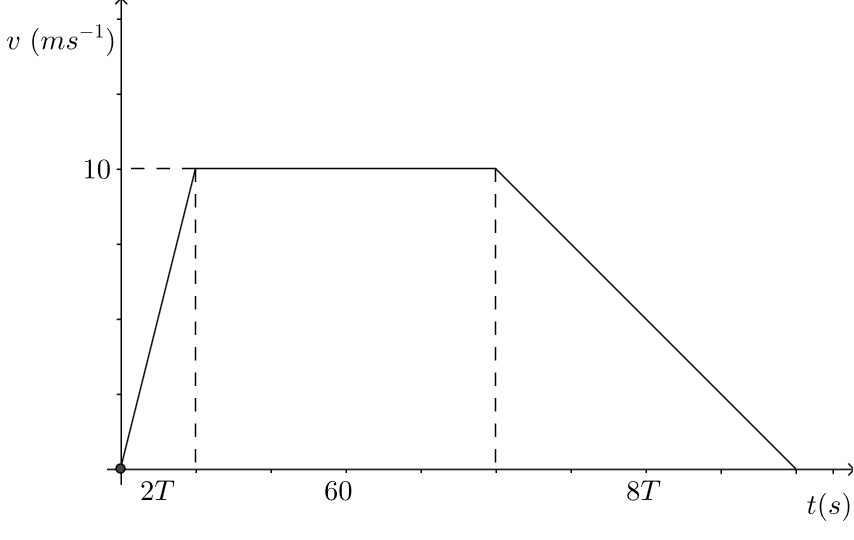
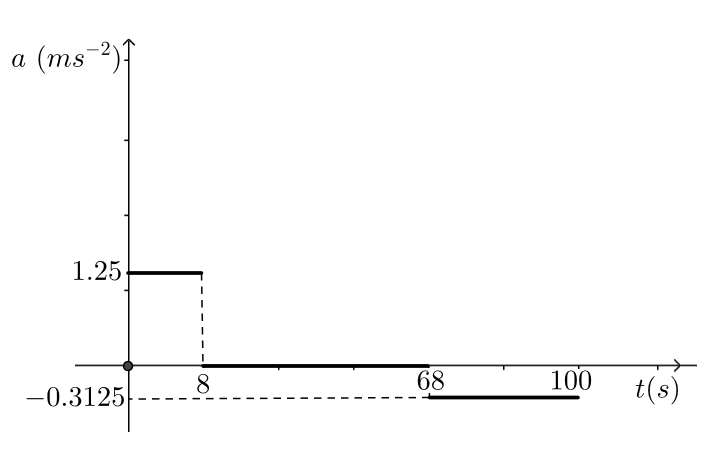
The area of a trapezium is \begin{align} s & = \frac{1}{2} (a+b) h, \\ & = \frac{1}{2} (60 + 2T + 60 + 8T) \times 10, \\ & = 5 (10T + 120) \mathrm{m}. \end{align} Where $a$ represents the shorter of the two parallel sides of the trapezium and $b$ represents the other. We are given that $s=800 \mathrm{m}$, so we equate this to the above expression and solve for $T$. \begin{align} 5 (10T + 120) & = 800, \\ 10T + 120 & = 160, \\ 10T & = 40, \\ T & = 4. \end{align} The acceleration in the first $2T=8 \mathrm{seconds}$ is given by \begin{align} a& = \frac{10}{8}, \\ & = 1.25 \mathrm{ms^{-2} }. \end{align} Here, for the first 8 seconds the $v$-coordinate increases by 10 as the $t$-coordinate increases by 8, this gives a positive answer. The acceleration in the last $8T=32$ seconds is given by \begin{align} a & = \frac{-10}{32}, \\ & = -0.3125 \mathrm{ms^{-2} }. \end{align} Here, in the last 32 seconds the $v$-coordinate decreases by 10 as the $t$-coordinate increases by 32. This gives a negative answer.
Test Yourself
Try our Numbas test on Linear measure - distance and length.
Try our Numbas test on Speed.