Other Measures of Dispersion
Skew
Definition
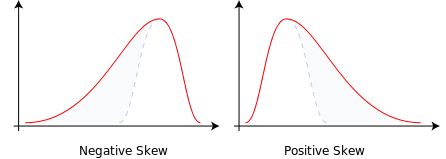
The skew of a distribution is a measure of its asymmetry. For example, the normal distribution is not skewed as it is perfectly symmetric. However most distributions are either positively or negatively skewed.
Negative skew would be indicated by a graph with a long left tail and a large area below the curve toward the right hand side of the distribution.
Positive skew would be indicated by a graph with a long right tail and a large area below the curve toward the left hand side of the distribution.
Range
Definition
Given a set of data, the range is the difference between the largest and smallest observations.
Video Example
Dr. Lee Fawcett calculates the range of two sets of data.
Quartiles
Definition
Given an ordered set of data, the quartiles are the points that split the data into sets, each (as far as is possible) of equal size. The first quartile, denoted as , is the value that splits off the lowest % of data from the highest %. The position of is calculated by The second quartile, , cuts the data set in half and is another word for the median and is calculated in the same way. The third quartile, , is the value that splits off the highest % of data from the lowest %, the position of is calculated by If the position of the quartile lies between two data values, add these data values together and divide by to find the value for the quartile.
Video Example
This is a video on quartiles produced by Alissa Grant-Walker.
Interquartile Range
Definition
The interquartile range is the set of numbers between the first and third quartiles. By the definition of quartiles, we can see that the interquartile range is composed of the middle % of the data. The interquartile range can be found as follows:
Video Examples
Example 1
This is a video on calculating the interquartile range produced by Alissa Grant-Walker.
Example 2
Dr. Lee Fawcett calculates the interquartile range of two sets of data.
Outliers
Definition
An outlier is an observation in a data set which is far removed in value from the others in the set. It is an unusually large or an unusually small value compared to the others.
An outlier might be the result of an error in measurement, in which case it will distort the interpretation of the data having, for example, undue influence on the mean. However an outlier may be a genuine result indicating, perhaps, a peculiarity of the process under study. For this reason, all outliers must be examined carefully and not be routinely removed without further justification.
Detecting an Outlier
There is no rigorous mathematical definition for what exactly is or isn't an outlier, however there are a few tests and criterions that can be applied. These include Chauvernet's criterion, Peirce's criterion, Grubb's test for outliers and Dixon's Q-test.
Commonly used rules for recognising outliers include and
Worked Example
Worked Example
Find an outlier given the data set
Solution
We can see the observation is extremely large with respect to the rest of the data, hence we can immediately determine that it is an outlier.
Video Example
This is a video on detecting outliers produced by Alissa Grant-Walker.
Workbooks
These workbooks produced by HELM are good revision aids, containing key points for revision and many worked examples.
- Describing data including work on quartiles and measures of spread.
- Exploring data including work on outliers and skew.