Student $t$
Definition
The Student $t$-distribution is the distribution of the $t$-statistic given by \[t= \frac{\bar{x} - \mu}{\frac{s}{\sqrt{n}}}\] where $\bar{x}$ is the sample mean, $\mu$ is the population mean, $s$ is the sample standard deviation and $n$ is the sample size.
The Student $t$-distribution allows us to analyse data sets using the normal distribution which otherwise would be unsuitable for analysis. In particular when we do not know the population standard deviation, but we can calculate the sample standard deviation from the data obtained.
Mean and Variance
The mean of the Student $t$-distribution is always $0$.
The variance of the Student $t$-distribution with $v$ degrees of freedom is \[Var[X] = \frac{v}{v-2}\] with $v>2$.
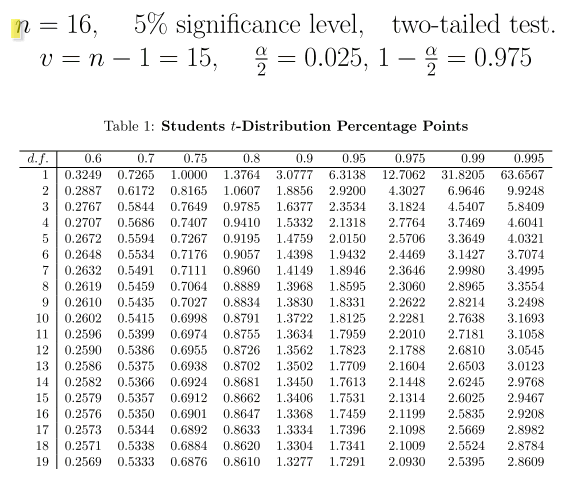
Reading Tables
When performing a Student $t$-test, to find the critical value, we have to read the tables. We find the value $t_{\alpha, v}$ where $\alpha$ is the significance level and $v$ is the number of degrees of freedom. Note that $v=n-1$ where $n$ is the sample size.
To find the critical value $t_{\alpha, v}$ first, take the value given for $v$, the number of degrees of freedom we have and look down the first column until that number is reached. Highlight this row.
Now take \begin{cases} 1-\alpha \qquad &\text{if a 1-tailed test is being used,} \\ 1-\frac{\alpha}{2} \qquad &\text{if a 2-tailed test is being used.} \end{cases}
Read along the top row until you come to this value. Then look down that column until you reach the highlighted row. This value is the critical value.