Limits and Continuity (Economics)
Limit
A limit (or limiting value) is the (output) value that a function or sequence approaches as the input approaches some particular value. Limits are an vital part of differentiation and integration and also help us to graph functions.
The notation for limits is
\[\displaystyle{\lim_{x\rightarrow c} f(x) = l}\] or \[f(x) \rightarrow l\text{ as } x\rightarrow c\]
which means: the function $f(x)$ tends to (approaches) $l$ as $x$ tends to (approaches) $c$.
One-Sided Limits
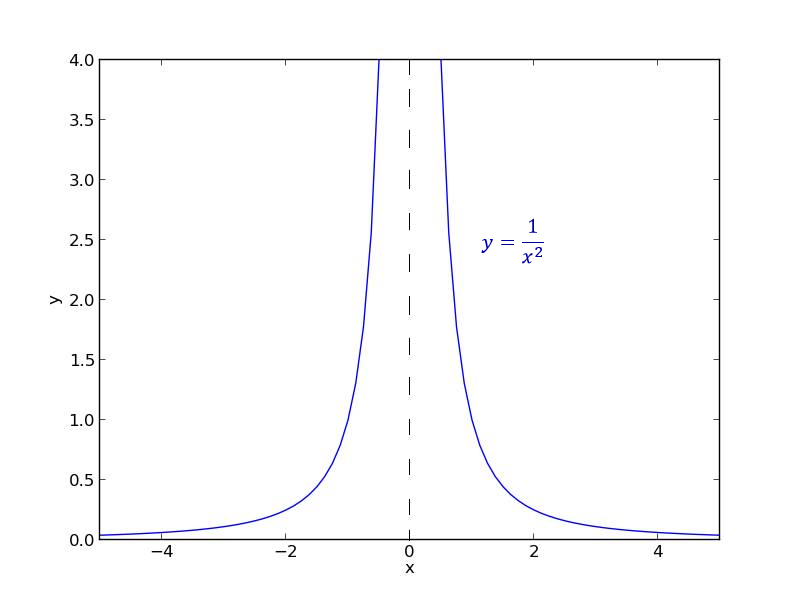
A one-sided limit is the (output) value that a function or sequence approaches as the input approaches some particular value either from above (a right-sided limit) or below (a left-sided limit). We write a right-sided limit as \[\displaystyle{\lim_{x\to c^+} f(x) = l}\;\;\;\text{ or }\;\;\;f(x)\rightarrow l\text{ as }x\rightarrow c^+\] and a left-sided limit as \[\displaystyle{\lim_{x\to c^-} f(x) = l}\;\;\;\text{ or }\;\;\;f(x)\rightarrow l\text{ as }x\rightarrow c^-\] Consider the function $f(x)=\frac{1}{x}$. This function is undefined for $x=0$ (we have a discontinuity). As we can see from the graph below, as $x$ approaches $0$ from above (starts at $+\infty$ and becomes less and less positive) $f(x)$ tends towards $+\infty$. We can write: \[\displaystyle{\lim_{x\to 0^+} f(x) = +\infty}\] This is the right-sided limit of the function $f(x)=\frac{1}{x}$.
On the other hand, as $x$ approaches $0$ from below (starts at $-\infty$ and becomes less and less negative), $f(x)$ tends towards $-\infty$, so we have: \[\displaystyle{\lim_{x\to 0^-} f(x) = -\infty}\] This is the left-sided limit of the function $f(x)=\frac{1}{x}$.
Two-Sided Limits
A two-sided limit exists if both of the one-sided limits exist and are equal. That is, we have
\[\lim_{x\to c} f(x) = l \Leftrightarrow \lim_{x\to c^-} f(x) = l \textit{ and } \lim_{x\to c^+} f(x) = l\]
and we say that $l$ is a well defined limit. Conversely, if the one-sided limits are not equal, we say that the limit is not well defined.
As we've seen, the two one-sided limits of the function $f(x)=\frac{1}{x}$ are not equal. The left-sided limit is $-\infty$ and the right-sided limit is $+\infty$ so the limit of the $f(x)=\frac{1}{x}$ is not well defined.
Continuity
A continuous function is essentially a function with no “gaps”: we can draw the graph of the function without taking our pen off the paper. For a function $f(x)$ to be continuous at a point $x=a$, we require all of the following to be true:
1) The limit must be well defined at $x=a$: \[\displaystyle{\lim_{x\to a^-}} = \displaystyle{\lim_{x\to a^+}}\] 2) The function $f(x)$ is defined at $x=a$
3) The output of the function is equal to the limit at $x=a$: \[f(a)=\displaystyle{\lim_{x\to a}}\]
Note: Condition 3) is the most important as for 3) to be true, 1) and 2) must also be true.
Note: If the limit is not defined at a point $x=a$, then the function is not continuous at $x=a$. However, a function which is continuous at $x=a$ does not necessarily have a well-defined limit at $x=a$.
Aymptotes
Vertical Asymptote
If a function $f(x)$ has a discontinuity at $x=a$ then $x=a$ is a vertical asymptote of $f(x)$.
Horizontal Asymptote
If a function $f(x)$ tends towards a number $l$ as $x$ tends towards positive or negative infinity: \[\displaystyle{\lim_{x\to \infty^+} f(x) = l}\] or \[\displaystyle{\lim_{x\to \infty^-} f(x) = l}\] then $l$ is a horizontal asymptote of $f(x)$.
For example, looking at the graph above, $y=0$ is a horizontal asymptote of the function $f(x)=\frac{1}{x}$.
Worked Examples
Worked Example
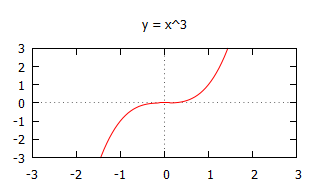
Find the limit of the function $f(x) = x^3$ as $x\rightarrow -\infty$.
Solution
To start, put a few decreasing values of $x$ into the function to get an idea of the behaviour of $f(x)$. It may also be helpful to look at the graph of $f(x) = x^3$.
|
$x$ |
$0$ |
$-1$ |
$-2$ |
$-3$ |
$-10$ |
$-20$ |
$-100$ |
|---|---|---|---|---|---|---|---|
|
$f(x)$ |
0 |
-1 |
-8 |
-27 |
-1000 |
-8000 |
-1000000 |
We can see that as the values of $x$ decrease, the value of $f(x)$ is clearly getting more and more negative.
So we say $f(x) \rightarrow -\infty$ as $x\rightarrow -\infty$ or $\displaystyle{\lim_{x\rightarrow -\infty} x^3} = -\infty$.
Solution
A limit is well defined if both of the one-sided limits are equal. Let's first consider the function as $x$ approaches zero from below:
|
$x$ |
$-1$ |
$-0.5$ |
$-0.1$ |
$-0.05$ |
$-0.01$ |
$-0.005$ |
$-0.001$ |
|---|---|---|---|---|---|---|---|
|
$f(x)$ |
-1 |
-8 |
-1000 |
-8000 |
-1000000 |
-8000000 |
-1000000000 |
We can see from the above table that as $x$ approaches zero from below, $f(x)$ tends rapidly towards negative infinity (remains negative and gets larger and larger in absolute value). We have: \[\lim_{x\to 0^-} f(x) = -\infty\]
Let's now consider the function as $x$ approaches zero from above:
|
$x$ |
$1$ |
$0.5$ |
$0.1$ |
$0.05$ |
$0.01$ |
$0.005$ |
$0.001$ |
|---|---|---|---|---|---|---|---|
|
$f(x)$ |
1 |
8 |
1000 |
8000 |
1000000 |
8000000 |
1000000000 |
We can see from the above table that as $x$ approaches zero from below, $f(x)$ tends rapidly towards positive infinity (remains positive and gets larger and larger). We have: \[\lim_{x\to 0^+} f(x) = +\infty\]
Since $-\infty \neq +\infty$ the one-sided limits are not equal so the limit is not well defined.
Solution
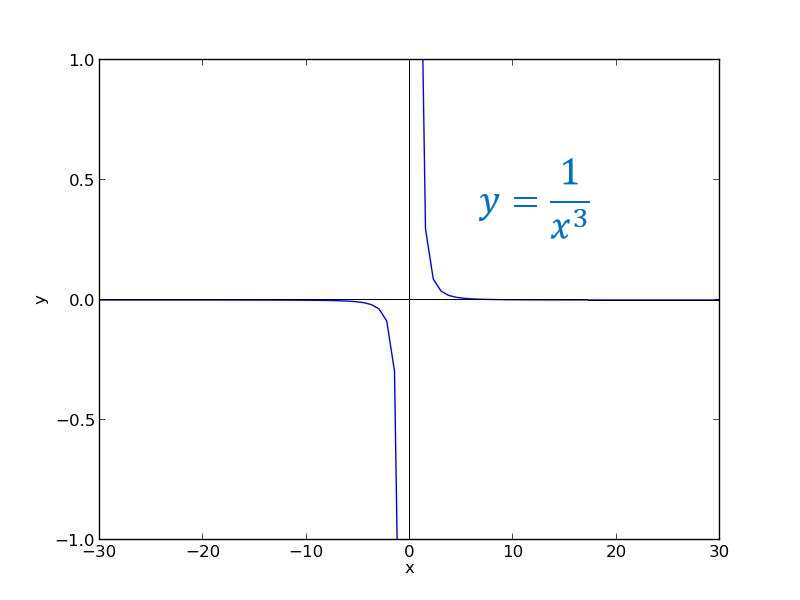
First notice that the function $h(x)=\dfrac{1}{x^3}$ is undefined at $x=0$ so $x=0$ is a vertical asymptotic of the function.
We discovered in the previous example that $h(x)=\dfrac{1}{x^3}$ approaches $-\infty$ as $x$ approaches $0$ from below, and $h(x)=\dfrac{1}{x^3}$ approaches $+\infty$ as $x$ approaches $0$ from above.
To determine whether the function $h(x)=\dfrac{1}{x^3}$ has any horizontal asymptotes, we must examine the behavior of the function as $x\rightarrow \pm infty$. Let's first look at the behaviour of $h(x)$ as $x\rightarrow -\infty$:
|
$x$ |
$-1$ |
$-2$ |
$-5$ |
$-10$ |
$-15$ |
$-20$ |
$-25$ |
|---|---|---|---|---|---|---|---|
|
$f(x)$ |
-1 |
-0.125 |
-0.008 |
-0.001 |
-0.000296296296 |
-0.000125 |
-0.000064 |
We can see that as $x$ becomes more and more negative (tends towards negative infinity), $f(x)$ rapidly becomes smaller and smaller (tends towards zero from below). We have: \[\lim_{x\to -\infty} f(x) = 0^-\] so there is a horizontal asymptotic at $y=0$.
Let's now look at the behaviour of $h(x)$ as $x\rightarrow +\infty$:
|
$x$ |
$1$ |
$2$ |
$5$ |
$10$ |
$15$ |
$20$ |
$25$ |
|---|---|---|---|---|---|---|---|
|
$f(x)$ |
1 |
0.125 |
0.008 |
0.001 |
0.000296296296 |
0.000125 |
0.000064 |
We can see that as $x$ gets larger and larger (tends towards positive infinity), $f(x)$ rapidly becomes smaller and smaller (tends towards zero from above). We have: \[\lim_{x\to +\infty} f(x) = 0^+\] We now have enough information to plot the function:
Video Examples
Example 1
Prof. Robin Johnson finds the limit of $\dfrac{x^2+1}{x^3+1}$ as $x\rightarrow 1$.
Example 2
Prof. Robin Johnson finds the limit of $\dfrac{x^2-4}{x-2}$ as $x\rightarrow 2$.
External Resources
- Limits of functions workbook at [www.mathcentre.ac.uk mathcentre].
- Limits (An Introduction) at Maths is Fun
- Evaluating Limits at Maths is Fun