Data Visualisation Research
From data to insight.
At Newcastle University’s Centre for Data Science and AI, we lead cutting-edge research in data visualisation, advancing the science of turning complex data into actionable understanding. Our work blends computational innovation, interactive design, and human cognition to make data interpretable, trustworthy, and impactful for both experts and broader audiences.
Why data visualisation matters
Data visualisation connects data science and AI with human understanding. As data, models and automated systems become more complex, visualisation is essential for interpretation, oversight, communication and trustworthy decision-making. At Newcastle, we combine methodological innovation with interdisciplinary collaboration to address major real-world challenges.
It translates data from its raw state to structured information, knowledge, and wisdom.
Our research strengths
We work across the full data-to-human pipeline, from algorithms and representations to interface design, perception and evaluation. Our strengths include:
- Visual analytics for complex and high-dimensional data
Developing new interactive systems that help experts explore patterns, anomalies, and relationships in large datasets. - Human-AI collaborative interfaces
Designing visual methods that support human oversight of automated models and ensure interpretability of AI decisions. - Graph, network and hierarchical visualisation
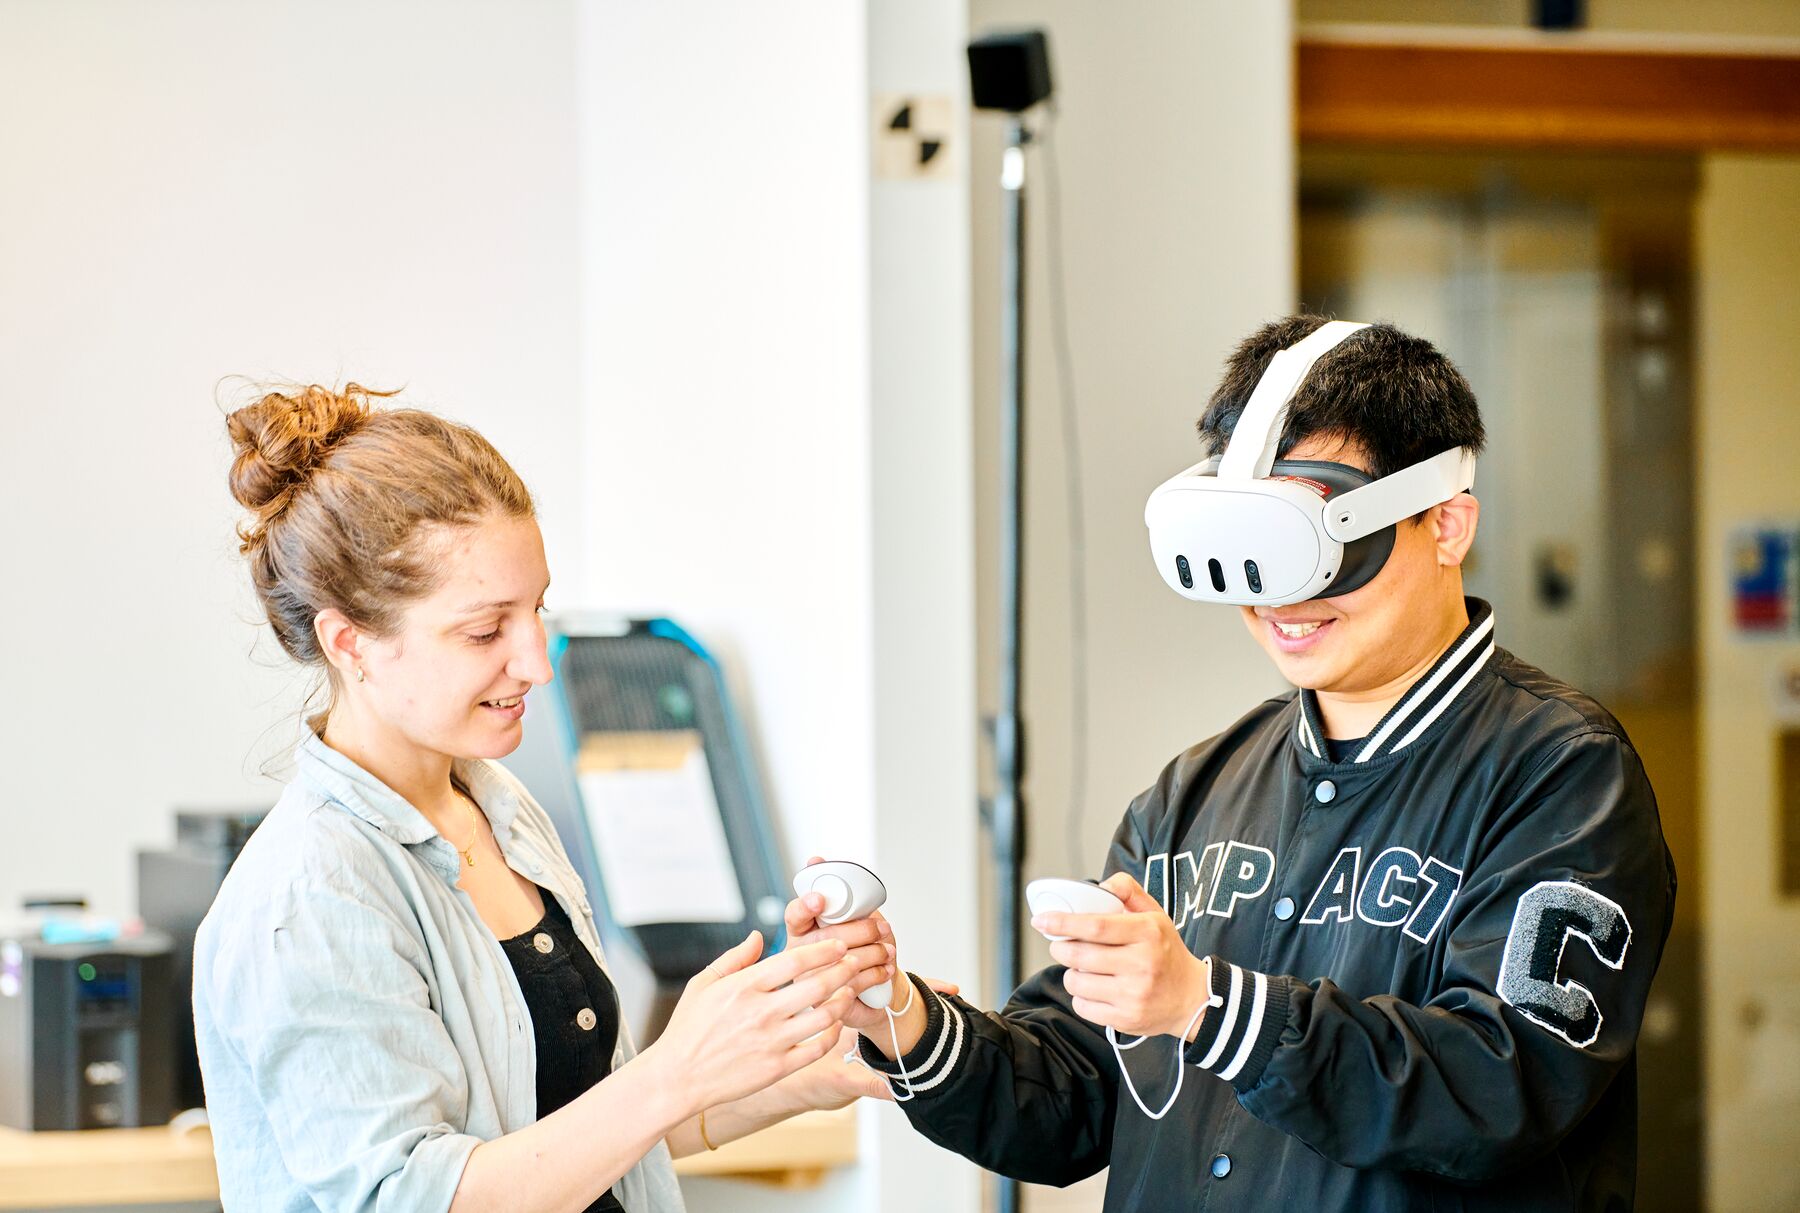
Creating scalable visualisation techniques and interactive tools for analysing relationships and structures in complex networks, hierarchical systems, and interconnected data. - Perception and immersive visualisation
Investigating how human perception and immersive environments such as virtual and augmented reality can enhance understanding, exploration, and interaction with complex data. - Data storytelling and communication
Integrating narrative techniques with visualisation to make insights accessible across domains and skill levels.
Impact areas
Our research spans multiple application domains, illustrating the real-world utility of advanced visual analytics:
- Genomics & biomedical data
Enabling scientists to explore large biomolecular datasets and derive biological insight. - Urban analytics
Visual tools for understanding city-scale dynamics, infrastructure, mobility, and environmental measurements. - Machine learning explainability
Visual methods that help model developers and end-users understand predictions and biases. - Decision support in policy and business
Visual systems that make complex evidence transparent and actionable.
Partnerships
We collaborate with partners in industry and public sector organisations to co-design tools that are robust, usable, and impactful in practice.
Our partners