Linear Functions (Economics)
Functions
A function is like a machine that takes a number (an input), changes this number (by adding another number to it, multiplying it by another number etc.) and gives back the changed number (an output). The output is always related to the input in some way so the same input will always give the same output.
We typically denote the input (or independent variable) by $x$ and the output corresponding to $x$ (or the dependent variable) by $y$ or $f(x)$. $f(x)$ says that $f$ is a function of $x$. For example, $x$ might be a person's income and $f(x)$ might be the amount they spend on food each week.
Note: An equation can be called a function when the equation contains only two variables and for each value of one variable there can only be one possible value of the other.
Note: Although the output of a function is commonly denoted by $f(x)$, $f$ can also be replaced by other letters; for example we could use $g(x)$.
The function \[y=5x^2+1\] says that for any input $x$, we obtain the corresponding output $y$ by first squaring $x$, then multiplying by $5$, and finally adding $1$. If we chose $x=3$, then the output would be: \begin{align} y&=5\times(3^2)+1\\ &=5\times9+1\\ &=45+1\\ &=46 \end{align}
Domain and Range
The domain of a function, denoted by the letter $D$, is the set of all possible input values for which the function is defined. It is often useful to draw a sketch to help identify the domain of a particular function.
The range of a function is the set of output values that correspond with a given set of inputs; the range therefore follows from the domain of a function. The range is denoted by the letter $R$.
For more information and examples of finding the domain and range, see Domain and Range.
Linear Functions
A linear function is a function of the general form \[y = ax + b\] where $a$ and $b$ are constants. These functions are called linear as the variable $x$ is always to the power of one.
Examples of functions in economics which are often linear include the consumption function and demand and supply functions.
Linear functions are examples of one-to-one functions. This output of one-to-one functions is unique, which means that each output can only be produced from a single input. We say that there is a one-to-one mapping between the output and the input.
The roots of a linear function are the values of $x$ which make the right-hand side of the function equal to zero. That is, the value of $x$ which satisfy: \[ax+b=0\] All linear functions have only one root.
The graph of a linear function is always a straight line where $a$ is the slope or gradient of the line, and $b$ represents the $y$-axis intercept. The $x$-axis intercept of a linear function is the root of the function.
The best way to plot the graph of a linear function is to first make a table with a few $x$ values and the corresponding $y$ values and then plot each of these points. The points where the line intercepts the $x$- and $y$-axis are useful to make a note of.
Note: Another common way of writing linear functions is $y=mx+c$ where $m$ represents the slope and $c$ represents the $y$-axis intercept.
For more information about linear functions see Linear Functions and Equation of a Straight Line.
Gradient of a Line
The slope or gradient of a straight line is a measure of how steep the line is. It is the amount by which the value of the output $y$ changes when the value of the input $x$ increases by $1$. For instance, we might want to know by how much the quantity demanded changes when the price rises by $£1$.
We calculate the slope by dividing the change in the value of $y$ beween any two points on the line by the corresponding change in the value of $x$ between the same two points. This can be remembered as “rise over “run”: \[a=\dfrac{y_1 - y_0}{x_1 - x_0}=\frac{\triangle y}{\triangle x}\] Where $(x_0,y_0)$ and $(x_1,y_1)$ are two points on the function and $a$ is the slope of the function.
When the gradient is positive, the line goes upwards from left to right and increasing the gradient makes the line steeper. When the gradient is negative, the line goes downwards from left to right and decreasing the gradient makes the line steeper. A horizontal line has a gradient of zero.
For example, suppose you are running up a hill and that for every $20$ metres you move horizontally, you gain $5$ metres in height. The slope of the hill would be equal to \[\frac{\triangle y}{\triangle x}=\frac{5}{20}=0.25\text{ or } 25\%\]
Note: We can see by looking at the graph of any linear function that the slope of the line is constant: it is the same at every point along the line. Another way of thinking about this is that a given change in the value of $x$ always has the same effect on the value of $y$.
Intercepts
$Y$-axis Intercept
The $y$-axis intercept is the point where the graph of a function intersects with (“cuts”) the $y$-axis. In other words, it is the value that $y$ takes when $x=0$.
$X$-axis Intercept
The $x$-axis intercept is the point where the graph of a function intersects with the $x$-axis. It is the value that $x$ takes when $y=0$.
We can work out the $x$-axis intercept by rearranging the function to make $x$ the subject and setting $y$ equal to zero. For example, rearranging the function $y=2x+3$ to make $x$ the subject gives: \[x=\frac{y}{2}-\frac{3}{2}\] By setting $y$ equal to $0$ we can find the $x$-axis intercept: \begin{align} x&=\frac{0}{2}-\frac{3}{2}\\ &=\frac{3}{2} \end{align} So the $x$-axis intercept is $x=\frac{3}{2}$.
Note: All linear functions have only one $y$-axis intercept and one $x$-axis intercept due to the one-to-one mapping between $x$ and $y$: there can only be one value of $y$ corresponding to $x=0$ and one value of $x$ corresponding to $y=0$.
Worked Examples
Example 1
Write down the slope, $y$-intercept and $x$-intercept of $y=3x-5$.
Solution
The general form of a linear function is: \[y = ax + b\] For the given function we can see that $a=3$ and $b=-5$ so the slope of the function is $3$ and the $y$-intercept is $-5$. To find the $x$-intercept we must first rearrange the function to make $x$ the subject. This gives: \begin{align} 3x&=y+5\\ \Rightarrow x&=\frac{y}{3}+\frac{5}{3} \end{align} We must then set $y=0$ to obtain the value of $x$ when the line cuts the $x$-axis (the $x$-intercept): \begin{align} x&=\frac{0}{3}+\frac{5}{3}\\ &=\frac{5}{3} \end{align} so the $x$-intercept of the function $y=3x-5$ is $\frac{5}{3}$.
Example 1
Plot the graph of the function $f(x)=6x+10$ between $x=-4$ and $x=+4$.
Solution
The first step is to construct a table of values for each (integer) value of $x$ within the given range and the corresponding values of $y$:
|
$x$ |
$-4$ |
$-3$ |
$-2$ |
$-1$ |
$0$ |
$1$ |
$2$ |
$3$ |
$4$ |
|---|---|---|---|---|---|---|---|---|---|
|
$f(x)$ |
$-14$ |
$-8$ |
$-2$ |
$4$ |
$10$ |
$16$ |
$22$ |
$28$ |
$34$ |
We then transfer each of these pairs of values of $x$ and $y$ to coordinates on our graph and join them to form the graph of the function:
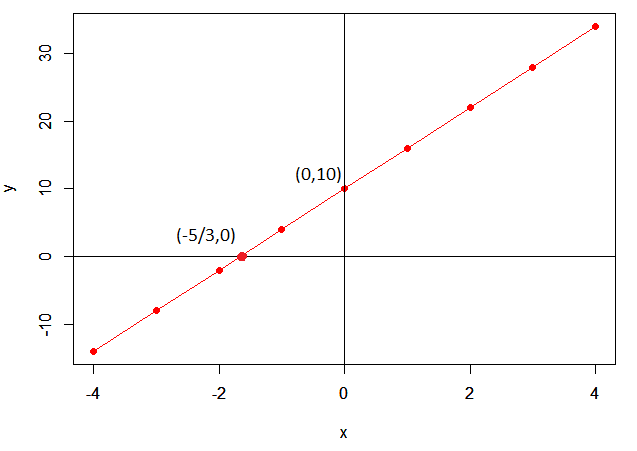
Useful checks: It is a good idea to check that the values of the $y$-intercept, $x$-intercept and gradient of the line observed in the graph correspond with the values determined from the equation of the line.
From the equation of the line we know that the:
- Slope of the function should be $6$
- $y$-intercept should be $10$
and we can work out what the $x$-intercept should be by rearranging the equation of the line to make $x$ the subject and then setting $f(x)=0$: \begin{align} f(x)&=6x+10\\ \Rightarrow6x&=f(x)-10\\ \Rightarrow x&=\frac{f(x)}{6}-\frac{5}{3}\\ \Rightarrow x&=\frac{0}{6}-\frac{5}{3}\\ \Rightarrow x&=-\frac{5}{3} \end{align} So the $x$-intercept should be $x=-\frac{5}{3}$.
Now, in the graph we can see that:
- The $y$-intercept is $10$
- The $x$-intercept is $-\frac{5}{3}$
and we can use the formula above to work out the equation of the line. Using the $x$-intercept and $y$-intercept as our two points, we have: \begin{align} \frac{\triangle y}{\triangle x}&=\dfrac{y_1 - y_0}{x_1 - x_0}\\ &=\dfrac{10-0}{0-\left(-\dfrac{5}{3}\right)}\\ &=\dfrac{10}{\frac{5}{3} }\\ &=\dfrac{30}{5}\\ &=6 \end{align} So the slope of the line is $6$. The values of the $y$-intercept, $x$-intercept and gradient of the line observed in the graph are therefore identical to the values determined from the equation of the line.
Implicit Linear Functions
An explicit function is a function in which the dependent variable is written on the opposite side of the equals sign to the dependent variable. We say that the independent variable is written explicitly as a function of the independent variable. For example, the linear function: \[y=4x+9\] is an explicit function because $y$ is written as a function of $x$.
Sometimes we will be given an implicit function where both of the variables are on the same side of the equation. For example, we can rewrite the explicit function from above as an implicit function by rearranging it so that variables are on the same side of the equals sign: \[y-4x=9\] or \[y-4x-9=0\]
Note: Since rearranging a function does not change the properties of a function, the implicit and explicit forms of a function have the same properties. They are simply different ways of writing the same function.
Worked Examples
Find $y$ in terms of the other variables and parameters:
a) $5y+4x=2$
b) $y-8x-5=0$
c) $3x=y+8$
Solution
For each of the given functions, we need to rearrange the equation to make $y$ the subject. This gives:
a) $y=\frac{2}{5}-\frac{4x}{5}$
b) $y=8x+5$
c) $y=3x-8$