
Engagement data
The engagement area in My Progress helps you and your Academic Adviser identify patterns in how you are engaging with your studies over time.
Engagement data can help you recognise positive engagement, notice changes and begin supportive conversations about your studies and university experience. It should be considered alongside the other information in My Progress and your personal circumstances. It is not intended to judge your commitment, ability or academic performance.
Students engage with their studies in different ways, so everyone’s engagement data will look different. Your engagement patterns may reflect your modules, your approach to learning, your personal circumstances and the learning opportunities available to you.
What engagement information is included?
My Progress presents engagement information from:
- Canvas activity
- ReCap activity
- participation in on-site timetabled sessions
Canvas and ReCap engagement is calculated differently from on-site engagement. The percentages should therefore be interpreted in different ways.
Canvas and ReCap engagement
Each week, you receive an engagement score for every module on which you are actively enrolled. For each module, your Canvas or ReCap activity is compared only with the activity of other students enrolled on that module. This means that the comparison reflects the different learning activities and patterns of engagement within each module.
The median engagement level for the module is used as the point of comparison:
- activity at or above the module median receives a score of 100%
- activity below the median receives a score relative to the median
- scores are capped at 100%
Your module scores are then combined to produce your overall Canvas and ReCap engagement scores. This is the percentage shown on the engagement graph. A score of 100% means that your activity is at or above the median for the modules included in the calculation. It does not mean that you have completed every available activity.
Example Canvas or ReCap calculation
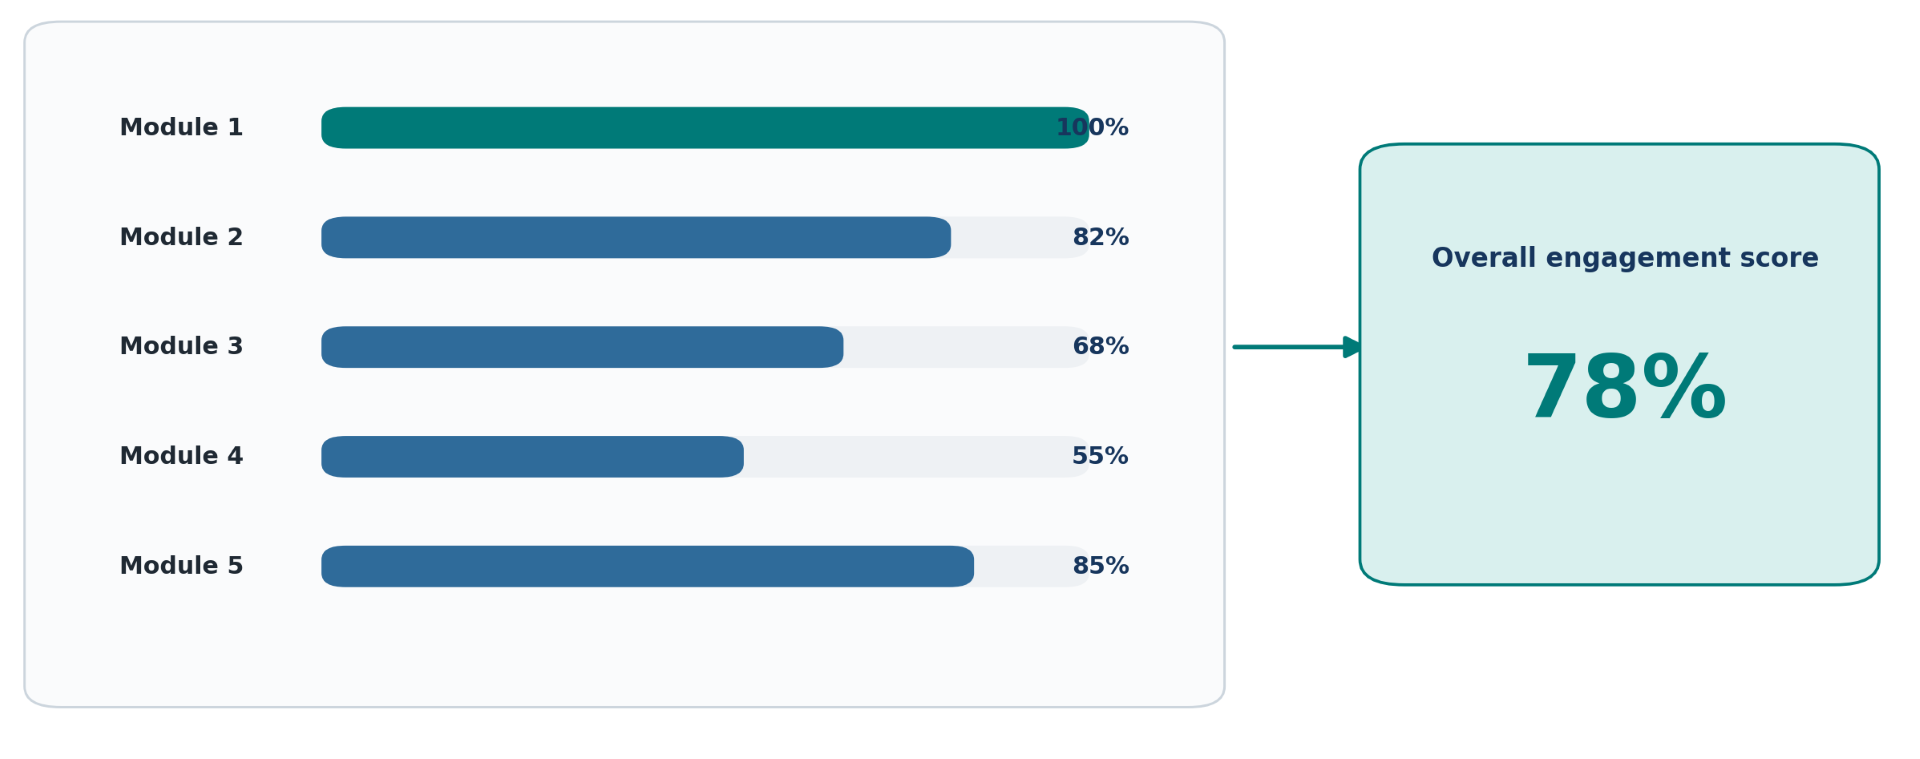
This example shows a student who is actively enrolled on five modules. For each module, the student’s Canvas or ReCap engagement is compared with that of other students enrolled on the same module.
The module scores are then combined to produce the overall engagement score shown in My Progress.
On-site engagement
Similar to the way ReCap and Canvas engagement is calculated, each week you receive an On-site engagement score for every module on which you are actively enrolled and have timetabled on-site sessions. This includes all timetabled on-site sessions, whether they are compulsory or optional. The On-site percentage is not your formal attendance record.
The key difference is that the calculation uses the highest number of sessions attended by a student on the module that week, rather than the total number of sessions available.
Example On-site calculation
If 15 sessions were scheduled on a module that week and the highest number attended by any student was 12, the calculation would use 12 as the highest attendance value, not 15.
The module median is then used as the point of comparison:
- attendance at or above the module median receives a score of 100%
- attendance below the median receives a score relative to the median
- scores are capped at 100%
Your module scores are then combined to produce your overall On-site engagement score. This is the percentage shown on the engagement graph. A score of 100% therefore means that your on-site engagement is at or above the module median. It does not mean that you have attended every available session.
How should I interpret the graph?
The engagement graph is updated on a weekly basis, with each update showing engagement activity from the previous week. Therefore, the engagement graph is most useful for identifying patterns over time, rather than focusing on a single percentage or a single week.
The engagement patterns may reflect:
- your individual approach to learning
- your personal circumstances
- other factors that are not visible in the graph